3D Scanning Device
January 2021 to April 2021
Overview & Scope
This is a microcontroller based device which scans it’s surroundings within the yz plane. The device uses a Time-of-Flight sensor to gather data points, serial communication to send/receive information, and Python to create a 3D visualization of the data that was gathered.
- MSP432E401Y microcontroller
- VL53L1X Time-of-Flight sensor
- ULN2003A-PCB stepper motor driver and stepper motor
- LED indicators to display device state
- External stop/start pushbutton
- Built-in sensor mount
This project is a part of the "Microprocessor Systems Project" (COMPENG 2DX4) course at McMaster University.

General Process
The process starts with microcontroller and Python script initialization. Once these are initialized, the device must be physically placed where the scanning is desired to take place. Through the press of a pushbutton, the stepper motor will start spinning. A data point will be taken by the Time-of-Flight sensor every 5.625 degrees for a total of 64 data points per scanning rotation. These data points are then processed within the Python script and are displayed as an interactive 3d visualization.

Gathering The Data
The VL53L1X Time-of-Flight sensor handles the transducer, precondition circuit, and ADC processes within itself. The sensor is accurate up to 4m and has a fast ranging frequency up to 50Hz. To measure distance, the sensor uses a 940nm invisible laser emitter with physical infrared filters and optics in order to achieve precise time of flight measurements for various ranges. To detect the returning IR laser, a single photon avalanche diode detection array is used. Once a time of flight measurement has been taken, the data is communicated through I2C communications using SDA and SCL signals, both of which have unique addresses, and both of which are included within a leader-follower relationship. The leader initiates a data transfer of 8-bit packets (followed by an acknowledgment bit). This is done at a speed of 100kbits/sec. The serial data is sampled upon the rising edge of the serial clock. Once the data is transmitted to the microcontroller using I2C, the microcontroller sends the data to the PC through UART communications. The data being sent from the microcontroller to the PC is being read in real time by the Python script.
Data Processing
To process the data points that are taken by the device, we must convert cylindrical coordinates to cartesian xyz-coordinates. We can do so by using the following formulas:
A conversion of x-axis data points is not needed as it is hard-coded into the Python script. The list of x-coordinates assumes 64 data points within each position of 0mm to 900mm, incrementing by 100mm each time (eg. 64 data points at 0mm, 64 data points at 100m, 64 data points at 200mm, and so on).
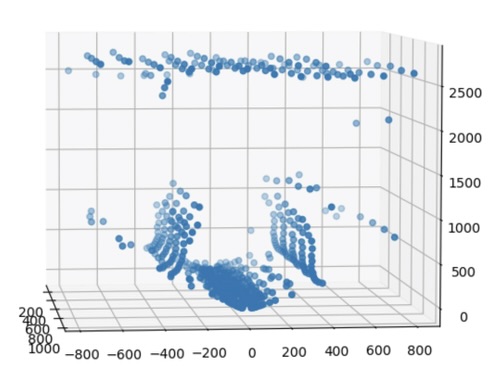
To plot the data points, the Python library “Matplotlib” version 3.4.1 was used. A simple scatter plot can be formed by passing in the x, y, and z lists that hold the coordinates into the scatter() function. The resulting graph can be shown by calling the show() function.
Demonstration
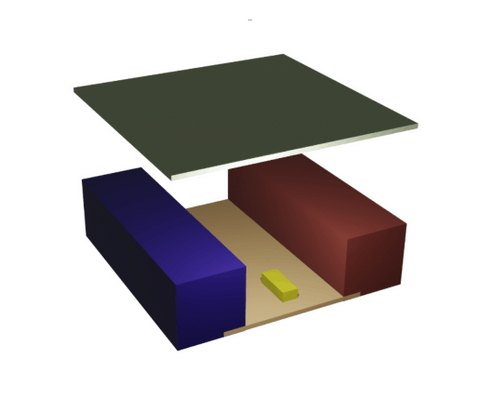
The following pictures show a 3D representation of an area that will be scanned, as well as the result given after the device's operations were completed.


